
Data Analytics Insights: From Raw Numbers to Decisions
A data analytics insight is a conclusion that tells you what is happening, why it is happening and what to do next. Data is the raw material and analytics is the work of organizing it. An insight is the sentence a team can act on. The last step is to test that sentence with an experiment before you bet budget on it. That is where A/B testing, which we build at Stellar, turns a good guess into a proven change.
This guide covers the definitions, a repeatable process for producing insights, examples for conversion and ecommerce teams, the mistakes that make insights misleading, and what a data insights analyst does.
TL;DR
- Data is raw facts, analytics is the processing of those facts, and an insight is an actionable conclusion that answers "so what?" and "now what?"
- A reliable insight comes from a question, a pattern, a plain-sentence explanation of why, one specific action and a measured result.
- Most weak insights are untested explanations. An A/B test is the cleanest way to confirm the "why" before you roll out a change.
- Filter signal from noise: check significance, compare against history, and confirm movements in related metrics.
- Lead every report with the conclusion, then the evidence, then the recommendation.
Table of Contents
- What data analytics insights actually are
- Data, analysis, analytics and insight: how they fit together
- How to turn data into a reliable insight
- Signal versus noise: when a movement is real
- Examples of useful insights for CRO, product and ecommerce teams
- Using insights to improve conversion and marketing decisions
- Common mistakes that make insights misleading
- What does a data insights analyst do?
- Perspective: why insights need an experiment
- Run your next insight as a test
- FAQ
- Sources
What data analytics insights actually are
Three words get used as if they meant the same thing. They do not.
Data is raw information: sessions, clicks, orders, timestamps. Analytics is processed information: the work of grouping, measuring and examining that raw material. Insights are the actionable conclusions that come out of it. That three-step ladder is how William & Mary's online program describes it. The same source notes that data-driven businesses run it as a loop: collect data, analyze it, find insights, act on them, and collect new data from the results.
A useful way to feel the difference is to take one number through all three steps.
| Layer | What it looks like | Example |
|---|---|---|
| Data | A raw record | 41,200 checkout page views last month |
| Analytics | A pattern in the records | 70% of visitors leave the checkout page |
| Insight | A cause and a next step | Mobile visitors leave because the 12-field form hides the submit button behind the keyboard, so shorten the form |
The last two rows come from a marketing guide on analytics versus insights's worked example, and the logic holds for any funnel. The 70% is analytics. The insight is the reason plus the fix.
Salesforce draws the same line for marketers: metrics say what is happening, while insights explain why and how to fix it. If a finding does not point at an action, it is still analytics, however polished the chart.
Three tests for a real insight
A finding earns the word "insight" when it passes three tests:
- It is new to the reader. It tells the team something they did not already believe.
- It points to an action. Someone can write the next task from it.
- It connects to a business problem. Revenue, conversion, retention, cost: something the company measures.
"Traffic is up 12%" fails all three. "Returning visitors from email convert at twice the rate of paid social visitors, so move the retargeting budget" passes them.
Data, analysis, analytics and insight: how they fit together
People also ask about the difference between data analysis and insights. Analysis is an activity. Analytics is the discipline and the toolset around it. Insight is the output that matters.
Analytics itself comes in levels. Marketing teams usually describe three: descriptive analysis explains past performance, predictive analysis models likely future outcomes from historical patterns, and prescriptive analysis recommends actions by simulating trade-offs. Many sources count four types by adding diagnostic analysis, the "why did it happen" layer. We lay out the four-type version in our guide to the 4 types of data analytics. Most CRO work lives in the diagnostic and prescriptive layers. You already know the funnel leaks. You need to know where, why, and which fix works.

If you are earlier in the journey, our beginner guide to marketing analytics covers the basics, and our practical guide to analytics shows how measurement connects to campaign choices.
How to turn data into a reliable insight
Fast conclusions feel productive and often are wrong. Researchers at Kellogg School of Management argue that managers should not rush to act on data. They propose a process in which you use data to understand, test and explain why a problem is occurring. According to the authors, that discipline narrows the data you need, makes it more relevant and points at root causes.
Here is a working version of that process for a marketing or CRO team.
Step 1: Start with a business question
Define the objective before you open a dashboard. "Why did checkout completion fall after the redesign?" is a question. "Let's look at the numbers" is not. Salesforce's guidance on building marketing insights also begins with defining the business objective, then collecting quantitative and qualitative data.
Step 2: Collect and unify the right data
Pull quantitative data (analytics, conversion events, sales) and qualitative data (surveys, session replays, support tickets). Put them where one person can compare them. Gaps matter here. A funnel with missing events will show a drop that is really a tracking problem. Our guides to multichannel conversion tracking and integrating analytics tools cover the plumbing.
Step 3: Find the pattern or outlier
Look for drop-off points, segments that behave differently, and anomalies against history. For ecommerce, Shopify lists the core conversion metrics as add-to-cart rate, checkout completion rate, cart abandonment rate and average order value, and recommends funnel analysis to find the stage that loses the most shoppers.
Step 4: Write the "why" in one plain sentence
This is the step most teams skip. Write: "We believe X happens because Y." If you cannot write it, you have analytics, not an insight. If you can write it, you have a hypothesis, which is the honest status of every insight before it is tested.
Step 5: Choose one specific action
Pick the smallest change that would prove or disprove the sentence. "Improve checkout" is a wish. "Cut the form from 12 fields to 6 on mobile" is an action.
Step 6: Test it and feed the result back
Run the change as a controlled experiment, measure it against the original, and record the outcome. A win becomes a rollout. A loss is still a finding, because it tells you the explanation was wrong, and that feeds the next cycle.

This is the point where analytics ends and experimentation begins, and where we think most teams lose the value of their insights. In Stellar you set up the variant in a no-code visual editor, so a marketer can launch the test from the sentence written in step 4 without waiting for a developer.
Signal versus noise: when a movement is real
Not every swing in a chart is an insight. A useful rule from the marketing analytics practitioners at Overdrive is that a signal is a change that is meaningful, sustained and tied to factors you can influence. Noise is short-term variance, incomplete data or a temporary anomaly. Their checks for telling them apart are practical:
- Compare current performance with historical averages.
- Check for statistical significance.
- Make sure the data is fresh and complete.
- Look for corroborating movement in related metrics.
The second check is where A/B testing helps most. A before-and-after comparison mixes your change with seasonality, promotions and traffic mix. A split test exposes both versions to comparable visitors at the same time, so the difference between them is much more likely to be caused by your change. That is why we treat experiments as the final stage of the insight process, not an optional extra.
Examples of useful insights for CRO, product and ecommerce teams
The examples below show the structure: observation, reason, action.
Funnel insight (mobile checkout). A 70% drop-off on checkout is analytics. The insight is that mobile users abandon because a 12-field form is obscured by the keyboard. The fix is a shorter, keyboard-friendly form. The example is from the marketer's guide mentioned earlier.
Shipping cost insight. Salesforce describes an online home goods retailer that found customers abandoned carts when shipping costs appeared only at checkout. Adding a transparent dynamic shipping calculator to product pages increased completed purchases. The same page describes a B2B software company that reduced churn by 15% by targeting onboarding at a friction point around day 60.
Segmentation insight. Splitting an audience by recency, frequency and monetary value, and sending a different message to each tier, is a common way to beat a single message to a whole list, according to the same marketer's guide.
Intent-to-cart insight. In a public ecommerce dataset, the weak point was getting viewers to add to cart. Cart-to-purchase was healthier. Where a leak sits decides which test comes first: product page or checkout.
Each of these is a hypothesis with a strong rationale. For a landing page team, the next move is a test: shipping message on the product page versus none, short form versus long form, a new headline versus the current one. If you advertise on search, dynamic keyword insertion lets a page echo the visitor's query, which is a simple way to test whether message match is your leak.
Using insights to improve conversion and marketing decisions
Insights only matter if they change what the team does. Three habits help.
Pick one or two north star metrics
BCG argues that leaders should identify one or two north star KPIs that matter for trade-offs and align marketing KPIs to business outcomes so metrics do not contradict each other. For an ecommerce team that may be revenue per visitor. For a SaaS team it may be activated trials. Every insight is then ranked by its likely effect on that number.
Rank insights by impact and effort
A team can generate twenty insights in a week and test three in a month. Score each one on expected lift, confidence in the "why" and effort to build the variant. Low-effort changes with strong evidence go first. When variants take minutes in a visual editor, the effort column shrinks, and the testing backlog moves faster.
Report the conclusion first
When you present, lead with the insight, then the evidence, then the recommendation. Burying the conclusion on the last slide guarantees it gets missed, as the guidance in the marketer's guide puts it. That is also the structure of this article.
For more on moving from reports to choices, see our piece on data-driven marketing decisions and data-driven marketing tactics. A study of why analytics lifts marketing ROI is also a good companion read when you need to defend measurement budget.
Common mistakes that make insights misleading
Treating a correlation as a cause. Two metrics moving together is a pattern. The reason needs a test. This is the main argument of the Kellogg researchers: understand and test before you act.
Ignoring seasonality and outside events. Ekimetrics notes that control variables for seasonality, competitive activity and external shocks separate analysis that informs decisions from analysis that merely confirms assumptions. A holiday spike is not proof your new banner works.
Trusting imperfect data without caveats. Privacy restrictions, tracking limits and platform differences mean even clean dashboards are incomplete. Overdrive's advice is to cross-validate key findings across sources and document the limits on the dashboard so stakeholders share the same picture before acting.
Reporting vanity metrics. Page views and follower counts rarely map to a decision. Tie every metric to the north star.
Stopping at the chart. The most common failure is a beautiful report with no owner and no experiment attached. Assign each insight a test, a person and a date to review the result.
What does a data insights analyst do?
A data insights analyst turns business questions into analysis and the analysis into recommendations. A typical employer posting for a data insights analyst role describes translating business requirements into analytical solutions, building visualizations, analyzing campaign performance, website activity and product engagement, and owning the lifecycle from the business problem to the dashboard and the narrative that drives a decision.
In practice the week splits into three kinds of work: recurring reporting, ad hoc deep dives and storytelling for stakeholders. The third is what separates an insights analyst from a report builder. Small teams often do this job without the title. A growth marketer who writes the "why" sentence and ships the test is doing it.
Perspective: why insights need an experiment
We build an A/B testing platform, so we see insights from the end of the pipeline: the moment someone has to decide whether to change a page.
Our view is simple. An insight you have not tested is a well-informed guess. That is fine, and it is where every good experiment starts. But guesses need a way to become decisions, and for most small and mid-sized teams the obstacle is not analysis. It is the wait: the ticket, the developer queue, the heavy script that slows the page being measured.
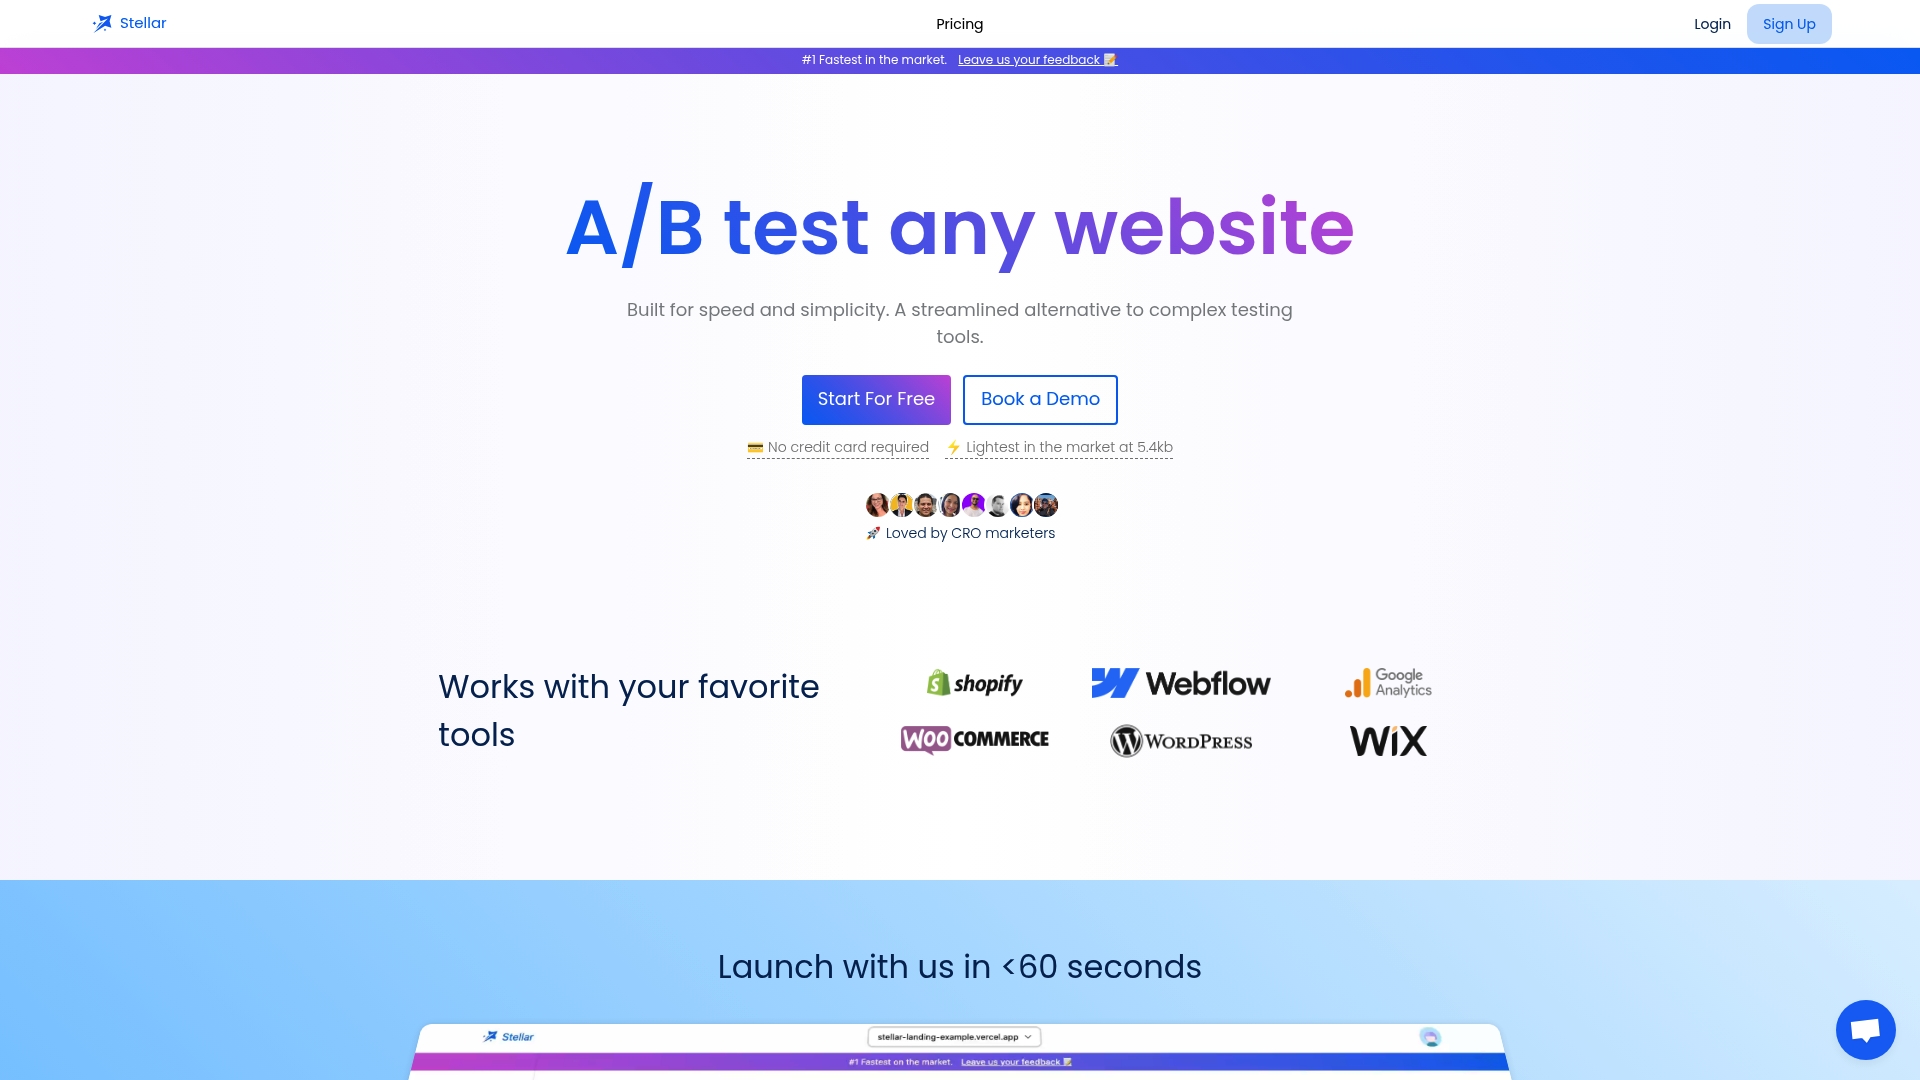
That is why we designed Stellar around speed. The script is only 5.4KB, so testing does not get in the way of the experience you are trying to improve. The no-code visual editor lets a marketer build the variant from the hypothesis directly. Goal tracking and real-time analytics show the result as it arrives, so the loop of collect, analyze, test and learn stays short.
If your team is producing insights faster than it can validate them, the bottleneck is experimentation, and that is the one we aim to remove.
Juan
Run your next insight as a test
If you already have a "why" sentence from your own data, the quickest next step is to test it. Stellar has a Sandbox plan at $0 per month for businesses under 25,000 monthly tracked users, and paid plans start with Plus at $29 per month. Pro is $99 per month and Scale is $399 per month. Enterprise has no published price. The editor works with WordPress, Shopify, Webflow, Wix, Squarespace, Framer and Bubble, so you can launch on the site you already have. See the plans on gostellar.app.
For reading on measurement before you start, our web analytics guide for marketers and explainer on BI analytics are good places to begin, and advanced analytics for marketing goes deeper on predictive methods.
FAQ
What are insights in data analytics?
Insights are actionable conclusions drawn from analyzed data. They answer "so what?" and "now what?" instead of only reporting a number. A good one reveals something new, points to a specific action and connects to a real business problem.
What is the difference between data analysis and insights?
Data analysis is the process of examining and organizing data to find patterns. An insight is the understanding that results: why a pattern exists and what to do about it. Analysis can be done without producing an insight, but an insight always rests on analysis.
What are the pillars of data analytics?
There is no single official list. Marketing teams commonly use descriptive, predictive and prescriptive analysis as three levels, and many add diagnostic analysis as a fourth. Check which framework your organization uses so reports share the same vocabulary.
How do I know an insight is reliable?
Check that the change is sustained, statistically significant, backed by fresh and complete data, and echoed in related metrics. Then test the proposed fix in a controlled experiment. A result that holds in a split test is far more trustworthy than one drawn from a before-and-after chart.
What does a data insight analyst do?
They translate business questions into analysis, build dashboards and visualizations, and present recommendations that influence decisions. The role typically covers campaign, website and product data, and ends with a narrative a stakeholder can act on.
Sources
- Data vs. Analytics vs. Insights, William & Mary
- Marketers, Don't Be Too Hasty to Act on Data, Kellogg Insight
- Marketing Insights: Types and Examples, Salesforce
- Ecommerce Data Analytics, Shopify
- Six Steps to More Effective Marketing Measurement, BCG
- Analytics and Insights: A Practical Guide for Marketers
- Interpreting and Acting on Your Data, Overdrive
- Marketing data analysis, Ekimetrics
- Data Insights Analyst II job posting