
Customer Journey Optimization: A Practical Guide for Marketers
Customer journey optimization is the ongoing work of finding where people stall or leave on the way to buying, then fixing those steps with evidence. You map one journey, measure it, form hypotheses, test changes and keep what wins. The same discipline applies whether you call it user journey optimization or customer journey optimization: the difference is mostly whether you start from a product screen or a whole relationship with the brand.
This guide walks through the process in the order a growth or CRO team would run it, with the metrics to watch and a worked example.
TL;DR
- Optimization is a loop: observe, test, iterate, learn. Mapping alone only documents the current experience.
- Map one persona, one scenario and one goal, so the map is specific enough to show real opportunities.
- Use analytics to find where people drop off and interviews or feedback to learn why.
- Rank ideas by impact, confidence and effort, then A/B test with a clear control, variant and guardrail metrics.
- Track conversion rate alongside satisfaction, effort and lifetime value, not conversion alone.
Table of Contents
- What customer journey optimization means
- Why it is worth the effort
- Step 1: Map one journey, not all of them
- Step 2: Find the friction with data
- Step 3: Prioritize hypotheses
- Step 4: Test the change
- A worked example
- Metrics that show it is working
- Coordinating channels and teams
- Personalization and tooling
- Perspective: why speed matters in journey testing
- Run your first journey test with Stellar
- FAQ
- Sources
What customer journey optimization means
Nielsen Norman Group describes journey management as the ongoing practice of researching, measuring, optimizing and orchestrating a customer journey to improve the experience and reach business goals. Optimization is the improvement step inside that practice.
UXCam frames it as systematically removing roadblocks so more customers move from one stage to the next, using both qualitative and quantitative data. It also separates the two jobs: a journey map documents the current experience, while optimization uses the map, behavioral data, testing, personalization and automation to improve it.
Customer journey vs. user journey
The terms overlap heavily. A user journey usually describes what someone does inside a site or product: landing page, signup, first key action. A customer journey is wider and covers marketing, sales, support and post-purchase contact. NN/G notes that journeys are cross-channel experiences involving marketing, products, support, staff and other teams, so the broader view often reaches beyond your website. If your focus is on-screen behavior, our guide to user journey optimization goes deeper on that slice.
Why it is worth the effort
According to UXCam, optimizing the journey helps reduce friction, raise satisfaction and increase conversion, and it can strengthen loyalty and lifetime value. The stages you can work on are awareness, consideration, conversion, retention and advocacy.

For most small and mid-sized teams, the biggest wins sit in the middle: a confusing pricing page, a long checkout, a signup form that asks for too much. These are visible in data and cheap to test, which makes them a sensible place to start before taking on the whole lifecycle.
Step 1: Map one journey, not all of them
A map is the baseline you optimize against. Atlassian recommends mapping one persona, one scenario and one goal, because a map that tries to cover everyone ends up too vague to expose anything.
NN/G describes two practical ways to begin: research-first mapping, built on primary research, and hypothesis-first mapping, built from a cross-functional workshop and what the team already knows. If you have little time, the hypothesis-first route gets a draft on the wall in a day, and research then corrects it.
Digital.gov advises documenting people and goals, behaviors, supporting services, key decisions, emotions and potential harms before you draw the sequence. That is a useful standard: a map that lists only pages and channels hides the reasons people hesitate.
A simple working map has these rows for each stage:
| Row | What you record |
|---|---|
| Action | What the person does |
| Question | What they are trying to find out |
| Decision | The choice they face |
| Channel | Where it happens |
| Emotion | Confidence, confusion, anxiety |
| Pain point | Where they stall or leave |
For a longer walkthrough aimed at conversion teams, see our piece on customer journey mapping for CRO marketers.
Step 2: Find the friction with data
Combine two kinds of evidence. Analytics shows where drop-offs happen. Interviews, surveys, support tickets and observation explain why. Orchetta's guide lists interviews, surveys, analytics, support analysis, observational research and focus groups as the main inputs, noting that analytics reveals drop-off points while customer quotes add the qualitative insight.
Sogolytics adds that operational data can expose drop-offs, channel switches and repeat contacts, and that feedback helps explain them. Repeat contacts are an underused signal: if people keep emailing support about shipping costs, the product page is not answering the question.

For teams with large event logs, a 2026 peer-reviewed study in Scientific Reports proposes grouping sessions into representative journey types and analyzing transitions between steps. Its core point is that sequences of behavior tell you more than isolated actions, although the logs need clustering and domain knowledge to stay readable. You do not need that machinery to begin: a funnel report for one goal is enough.
Where to look first
- The step with the largest absolute loss of people, not the largest percentage.
- Steps where mobile and desktop behave very differently.
- Pages that visitors return to repeatedly before leaving.
- Points where support questions cluster.
Our guide to marketing funnel optimization covers how to read these stage-to-stage losses.
Step 3: Prioritize hypotheses
You will end up with more ideas than you can test. The Pedowitz Group suggests defining outcomes and guardrails, then prioritizing hypotheses by impact, confidence and effort. Sogolytics offers a complementary lens for problem fixing: weigh volume, revenue exposure and cost, then assign an owner and a date.
Write each hypothesis in one line: "Because visitors from paid search leave at the pricing step, showing a plan comparison above the fold will raise trial starts." If you cannot finish the "because", you do not yet understand the problem and need more research.
Step 4: Test the change
A/B testing is how you separate a real improvement from noise. Per the Pedowitz Group, a sound experiment states a hypothesis, defines a control and variant, a target segment, success and guardrail metrics, duration and sample requirements, monitors live effects, and ends with a decision to roll out, refine or keep the control.
A few habits keep tests honest:
- Change one meaningful thing per test so you know what moved the result.
- Decide the duration and sample size before you start, then do not stop early because the graph looks good.
- Set a guardrail, such as refund rate or support contacts, so a gain in signups does not hide a loss elsewhere.
- Document every result, including flat ones. Learning compounds.
NN/G's version of this is a UX learning loop: observe and understand, test, iterate, learn. It is the same rhythm at a different scale.
A worked example
Imagine a store that sells subscription coffee. The map for a first-time buyer shows strong traffic, but the funnel report shows the biggest loss between product page and cart. Support tickets mention confusion about delivery frequency.
- Hypothesis: because shoppers cannot tell how often coffee ships, a short "how delivery works" block near the add-to-cart button will lift cart additions.
- Test: control is the current page; the variant adds the block. Success metric is add-to-cart rate; guardrail is order cancellations in the first 30 days.
- Decision: if the variant wins without hurting the guardrail, roll it out and move to the next step, perhaps the shipping cost reveal in the cart.
This is illustrative, not a result from a real client, but the shape holds for most ecommerce journeys: one friction, one test, one decision.
Metrics that show it is working
No single number tells you the journey is healthier. Twilio groups journey measures into satisfaction (CSAT), customer lifetime value, customer effort, session or activity time, bounce rate, email open rate and conversion rate, and provides formulas for each.
A practical pairing:
| Goal of the change | Primary metric | Guardrail |
|---|---|---|
| Get more visitors to act | Conversion rate | Bounce rate, effort score |
| Make checkout easier | Completion rate | Support contacts |
| Keep customers longer | Lifetime value | Satisfaction score |
Pair a behavior metric with a feedback metric. A page can convert better while customers feel more pressured, and the second number catches it.
Coordinating channels and teams
Journeys cross departments, so improvements stall when each team owns a fragment. NN/G names collaboration, unified customer data and integration of disparate systems as requirements for doing this well. In practice that means a shared dashboard, one owner per journey and a regular review.
If customers move between ads, email, site and in-person service, the experience should feel consistent at each handoff. This overview of omnichannel marketing and unified customer experience shows how to line those touchpoints up. For brands selling across regions, the same consistency applies to language, which is why teams also look at content localization for e-commerce.
Personalization and tooling
NN/G explains that personalization and orchestration use behavioral data to deliver the right interaction on the right channel at the right time, and that mature programs may add real-time interaction management and AI or machine learning. Smaller teams can start far simpler: segment by traffic source and show a headline that matches the ad. Our overview of personalization in digital marketing lays out where to begin.
The toolset for a lean team usually has four parts: analytics for funnels, a feedback method such as surveys, an experimentation tool and a shared place to record learnings.
Perspective: why speed matters in journey testing
We built Stellar around a simple belief: most small and mid-sized teams do not fail at journey optimization because they lack ideas. They fail because testing is slow, needs developers and weighs down the site they are trying to improve.
That is why our script is only 5.4KB and our visual editor needs no code. Our aim is that a marketer can spot a drop-off on Monday, build a variant by lunch and have the experiment live the same day, without adding drag to page speed.
Journey work rewards teams that run many small, well-measured experiments. Real-time analytics, goal tracking and dynamic keyword insertion, which matches landing page copy to the search that brought the visitor, are designed to make each of those experiments cheaper to run.
Juan
Run your first journey test with Stellar
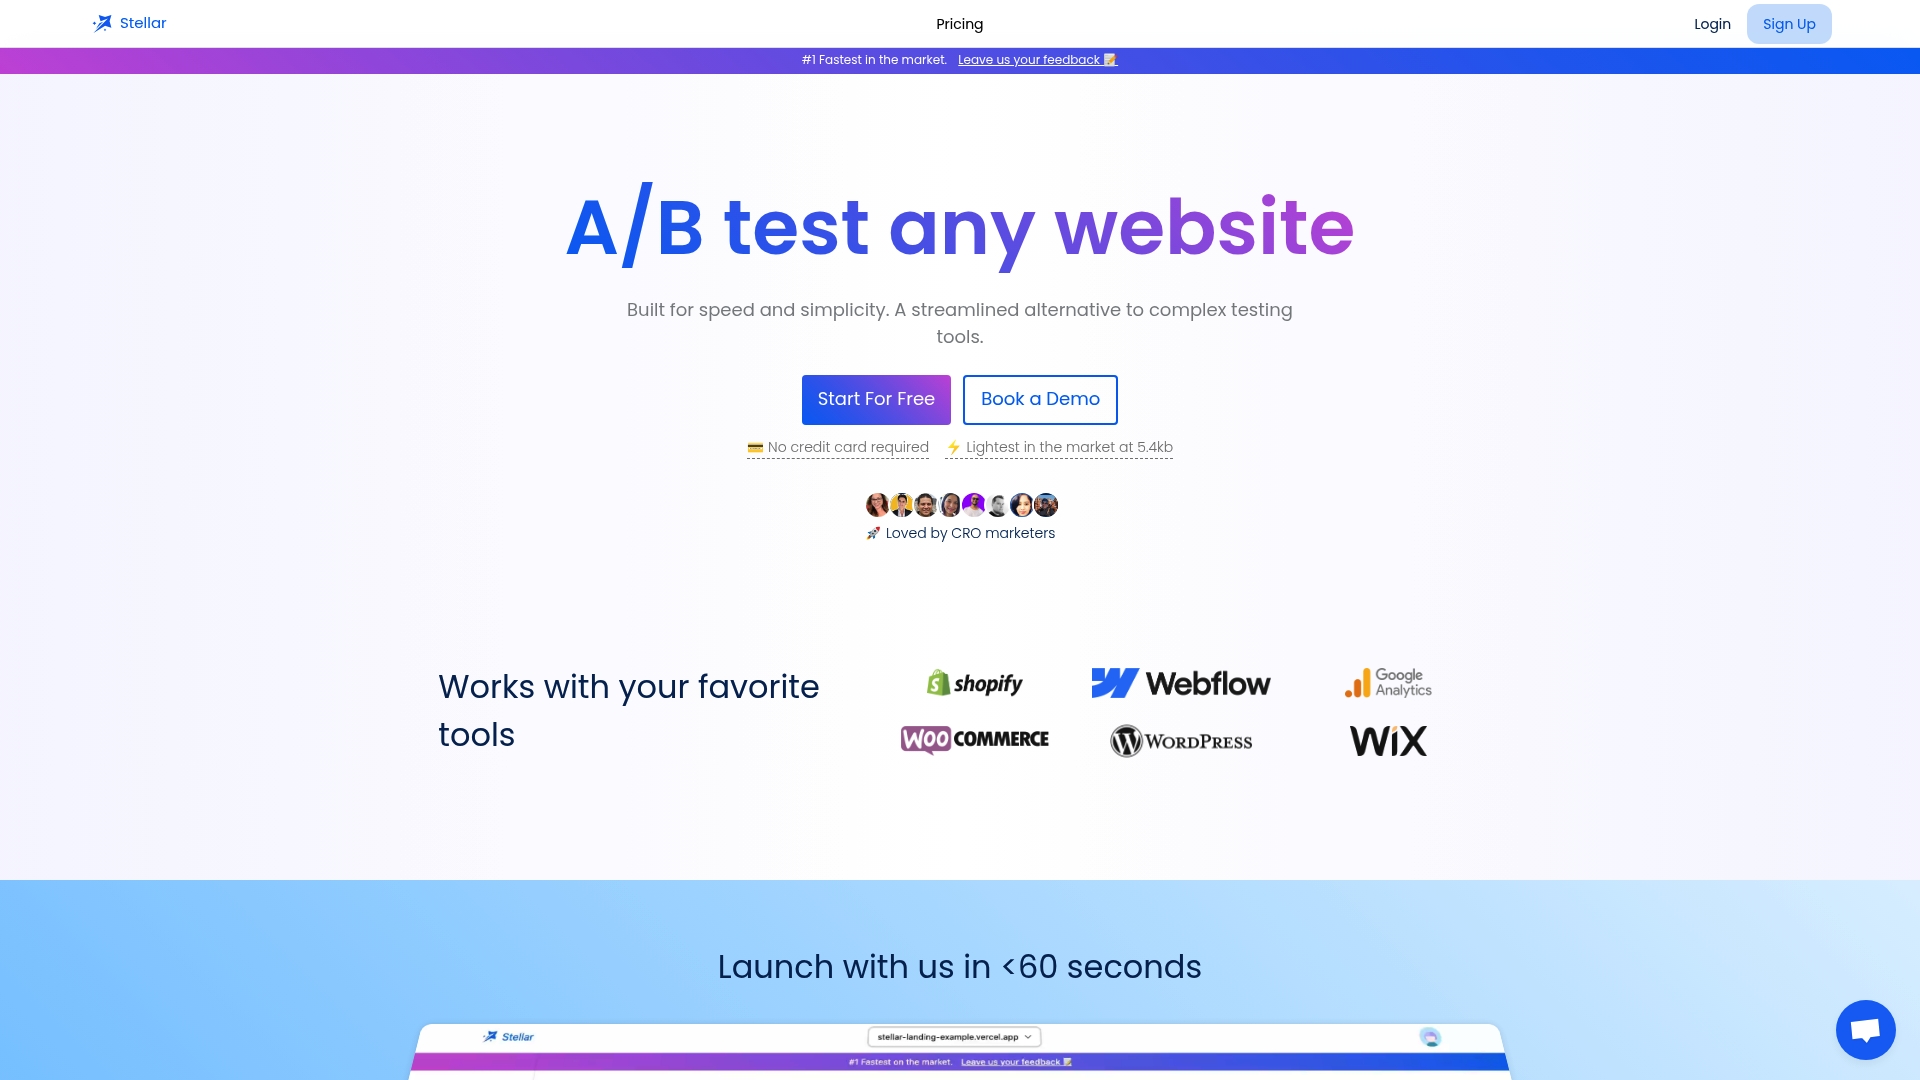
If you have a hypothesis ready, Stellar lets you build the variant in a no-code visual editor, set goals and watch results in real time. It connects directly with WordPress, Shopify, Webflow, Wix, Squarespace, Framer and Bubble. Plans are priced by monthly tracked users: Sandbox is $0 per month, Plus is $29 per month, Pro is $99 per month and Scale is $399 per month, with Enterprise available on request. You can start on the Stellar plans and pick the tier that matches your traffic.
Pair the tool with the process above: one journey, one friction, one test.
FAQ
What are the stages of the customer journey?
A common model uses awareness, consideration, conversion, retention and advocacy. Your own map may use different labels, but each stage should answer what the customer is trying to do and what might stop them.
How is journey mapping different from optimization?
Mapping documents the current experience. Optimization takes that map, adds behavioral data, testing, personalization and automation, and works to improve it. You map first, then optimize in repeating cycles.
How do I start if I have little data?
Begin with a hypothesis-first map built in a short team workshop, as NN/G describes, then check it against analytics and a handful of customer conversations. A free or low-volume plan is enough to run your first test.
Which metric should I optimize first?
Pick the one that matches the goal of your mapped journey, usually conversion rate for that step, and add a guardrail such as satisfaction or effort. Our guide to how to optimize customer experience shows how to pair them.
Sources
- The Practice of Customer-Journey Management, NN/G
- What is Customer Journey Optimization? UXCam
- A Complete Guide to Customer Journey Mapping, Atlassian
- How Practitioners Create Journey Maps, NN/G
- Map your users' and system's journeys, Digital.gov
- The Complete Guide to Customer Journey Management, Orchetta
- Customer Journey Management, Sogolytics
- Analyzing the digital customer journey, Scientific Reports
- How do I test and optimize journeys? Pedowitz Group
- Customer journey analytics, Twilio