
Analytics vs. Analysis: How CRO Teams Use Both
Analytics is the systematic, tool-driven examination of data: the dashboards, tracking and calculations. Analysis is the human work of interpreting what that data means and deciding what to do. For a conversion team the two only pay off together: analytics shows where visitors drop off, analysis turns that into a hypothesis, and an A/B test proves whether the fix works. Stellar's A/B testing platform is built for that last step, so a hypothesis becomes a live experiment without waiting on a developer.
TL;DR
- Analytics is the toolbox (tracking, calculations, reports). Analysis is the interpretation you build with it. You need both.
- There are four types of analytics: descriptive, diagnostic, predictive and prescriptive. Most CRO work lives in the first two and ends in an experiment.
- Analytics tells you where the funnel leaks. Only a controlled test tells you whether your fix works.
- A repeatable five-step routine (question, data, analysis, hypothesis, test) beats staring at dashboards.
- Stellar has a free Sandbox plan and paid plans from $29 per month, so the test step does not need a big budget.
Table of Contents
- Analytics vs. analysis in plain terms
- The four types of analytics and where CRO fits
- A five-step routine from raw data to a decision
- Why analytics alone is not enough for conversion work
- Common mistakes when mixing analytics and analysis
- Where to start if you have little traffic or budget
- Put your analysis to work with Stellar
- FAQ
- Sources
Analytics vs. analysis in plain terms
The two words are used interchangeably, which is why so many pages rank for this search with slightly different definitions. Here is the version that is useful on the job.
Watershed's guide describes analysis as the broader concept: what a person does when interpreting information and building a narrative or plan of action. Analytics is the more specific, systematic examination of data, the part a computer does when it accepts, stores, calculates and makes information available. Think of analytics as the tools and analysis as the building you do with them.
The Research Data Alliance's clarification of big data terms draws the same line from a professional standpoint. It calls analytics the systematic computational analysis of data, and the analysis process the careful study of something to learn about its parts and how they relate. Data analysis itself it defines as inspecting, cleaning, transforming and modeling data to discover useful information, suggest conclusions and support decisions.
Past versus future
A second common distinction is about time. EE Times explains that data analysis answers "what happened?" through detailed examination of past data, while analytics also addresses why it happened and what is likely next, using statistical and mathematical methods to cluster, segment, score and predict scenarios.
The Association of Financial Professionals puts it more bluntly: analysis is arithmetic on data, useful for explaining what happened in hindsight, while analytics is higher-level mathematics such as statistical correlation, which makes predictive estimates possible.
Activity versus capability
A third framing is closer to how teams actually work. Snowflake's documentation treats data analysis as a specific activity, such as investigating why churn rose last quarter, and analytics as the broader capability that makes that work repeatable: pipelines, consistent metric definitions, methods, tools and governance.
For a marketer, that is the practical takeaway. Analytics is what you set up once (events, goals, dashboards). Analysis is what you do every week with a specific question.
| Analytics | Analysis | |
|---|---|---|
| What it is | Systematic, tool-driven examination of data | Interpreting information to reach a conclusion |
| Who or what does it | Software, tracking, models | A person with a question |
| Typical output | Reports, dashboards, scores, forecasts | A narrative, a hypothesis, a decision |
| Time focus | Past, present and forward-looking | Often explains what already happened |
| CRO example | Funnel report showing a 62% drop at checkout step 2 | "Shipping costs appear too late, so we should show them earlier" |
The numbers in the last row are illustrative, not a benchmark.
The four types of analytics and where CRO fits
When people say "analytics" in a business context, they usually mean one of four types. Eurostat's glossary lists the same four, each suited to a different question.
- Descriptive: what happened? Trends pulled from raw data. Sessions, conversion rate, revenue per visitor, cart abandonment.
- Diagnostic: why did it happen? Eurostat describes three steps: identify anomalies, collect related data, then use statistical techniques to find relationships.
- Predictive: what will happen? Statistical and machine learning techniques such as regression and decision trees estimate likely outcomes.
- Prescriptive: what should we do? Methods that estimate the probability of different outcomes to recommend an action.
Harvard Business School Online frames them as a progression and recommends using all four in tandem for a full picture rather than picking one.
What this means for a conversion team
Most day-to-day CRO sits in the first two types. Descriptive analytics finds the page, step or segment with a problem. Diagnostic analysis asks why: is it traffic source, device, message match, price shock?
Predictive and prescriptive outputs are the ones to treat carefully. A forecast says a change will probably help. It does not replace running the change against a control. That is where experimentation comes in, and it is the reason analytics work should end in a test rather than in a slide deck.

A five-step routine from raw data to a decision
The questions readers ask most often here are about process: how do I get from numbers to something I can act on? This is a routine that works for small and mid-sized teams. For a wider view of the practice, our guide to data-driven marketing tactics goes deeper on each stage.
Step 1: Start with one question
Not "how is the site doing?" but "why do paid visitors leave the pricing page without clicking?" A narrow question tells you which metric matters and which to ignore. The Snowflake example of investigating a rise in churn is exactly this shape: one specific thing, examined.
Where it goes wrong: teams open the dashboard first and let the biggest number choose the question.
Step 2: Check that the tracking is trustworthy
Analytics is only as good as its events. Before you analyze, confirm that conversions fire once per action, that internal traffic is excluded, and that the same goal means the same thing across your tools. If you are new to this layer, marketing analytics for beginners covers the setup.
Where it goes wrong: double-counted purchases or a form event that fires on page load. Every conclusion built on them is wrong.
Step 3: Describe, then segment
Start with the descriptive view: conversion rate by stage of the funnel. Then split it. Device, traffic source, new versus returning, landing page. Averages hide the problem; segments reveal it. A site converting at an overall rate that looks acceptable can be failing completely on mobile checkout.
If you want to focus the effort where it counts, marketing funnel optimization shows how to rank funnel stages by impact.
Where it goes wrong: chopping data into so many segments that each has too few visitors to mean anything.
Step 4: Turn the finding into a hypothesis
This is the analysis step, and no tool does it for you. A good hypothesis has three parts: the observation, the change, and the expected effect. For example: "Mobile visitors abandon at shipping because costs appear only on the last step. If we show an estimate in the cart, mobile checkout completion will rise."
Two habits help. Write down the metric you expect to move before you build anything, and check your idea against what you know about buyer behavior; marketing psychology basics is a useful lens for generating variants. The article on validating marketing ideas covers how to filter weak ideas before they use up test traffic.
Where it goes wrong: treating a correlation as a cause. Diagnostic work finds relationships. Only a controlled comparison shows that your change caused the lift.
Step 5: Test it and read the result honestly
Run the variant against the original with traffic split at random, let it reach enough visitors, and judge it on the metric you named in advance. Then feed the result back into step 1. A win becomes the new baseline. A loss is still information about your visitors.
Our walkthrough on analyzing test results covers reading significance and avoiding early stops.
With Stellar, this step is where we take work off your hands: the no-code visual editor lets you build the variant on a web or mobile page without developer involvement, and the real-time analytics dashboards show the result as visitors arrive.
Why analytics alone is not enough for conversion work
The loop above exists because dashboards describe behavior but cannot confirm a remedy. Analytics can tell you the pricing page has a high exit rate. It cannot tell you whether a shorter headline, a different plan layout or a trust badge would fix it. Those are competing explanations, and the way to separate them is an experiment.
That is also why the most useful analytics are the ones tied to a decision. A metric nobody will act on is reporting, not analysis. When you evaluate your own reports, ask of each chart: if this number moved, what would we do differently? If the answer is nothing, retire it.
A practical way to keep both halves in balance is to split your week. Spend one block on analytics hygiene (events, goals, segment definitions) and another on analysis (reading, hypothesizing, deciding). Teams that skip the first block argue about whose numbers are right. Teams that skip the second collect data nobody uses.

Connecting marketing measurement to the test
Campaign-level measurement matters here too, because the traffic source often explains the result. If ad visitors behave differently from organic ones, a variant that wins for one may lose for the other. The guide on campaign tracking and what your ads earn shows how to tie spend to outcomes so you can segment tests by source.
For a fuller strategic view of how testing and measurement fit into one program, see this overview of conversion rate optimization in 2026.
Common mistakes when mixing analytics and analysis
- Confusing volume with insight. More reports do not create understanding. One clear question does.
- Analyzing past data to predict the future without testing. Past behavior is evidence, not proof, that a change will work.
- Reading too early. A test that looks like a winner after a day is often noise.
- Changing several things at once. If the variant differs in headline, image and layout, you will not know which one mattered.
- Skipping the write-up. A one-paragraph record of the hypothesis and the result makes your next analysis faster.
Where to start if you have little traffic or budget
Smaller teams often assume testing is for enterprises. It is not, as long as the tool stays out of the way. A heavy script slows pages, which can hurt the very conversions you are trying to improve, and a complicated setup means tests never launch.
Our Sandbox plan costs $0 per month and is meant for businesses below 25,000 monthly tracked users, enough to run your first experiments from the questions your analytics raised. Paid plans start at $29 per month (Plus), then $99 per month (Pro) and $399 per month (Scale). Enterprise is available without a published price. Plans are tiered by monthly tracked users and feature set.
We built Stellar around a simple belief: the gap between spotting a problem and testing a fix should be hours, not weeks.
Most teams we talk to are not short of data. They are short of the time and developer help it takes to act on it. Analytics tells you where the leak is, and analysis gives you a hunch, but until the hunch meets real visitors it is only an opinion.
That is why we focus on a lightweight script (5.4KB), a no-code visual editor and clear real-time analytics. A faster, simpler tool means more experiments per quarter, and more experiments means the analysis you do gets checked against reality again and again.
If you take one thing from this article, let it be this: treat analytics as the question generator and experiments as the answer generator.
Juan
Put your analysis to work with Stellar
Once your analytics has pointed at a weak page and your analysis has produced a hypothesis, Stellar is where you test it. You build the variant in the no-code visual editor, track it with advanced goal tracking, and watch results in real-time analytics dashboards. It integrates directly with WordPress, Shopify, Webflow, Wix, Squarespace, Framer and Bubble, and a data API is available for reporting.
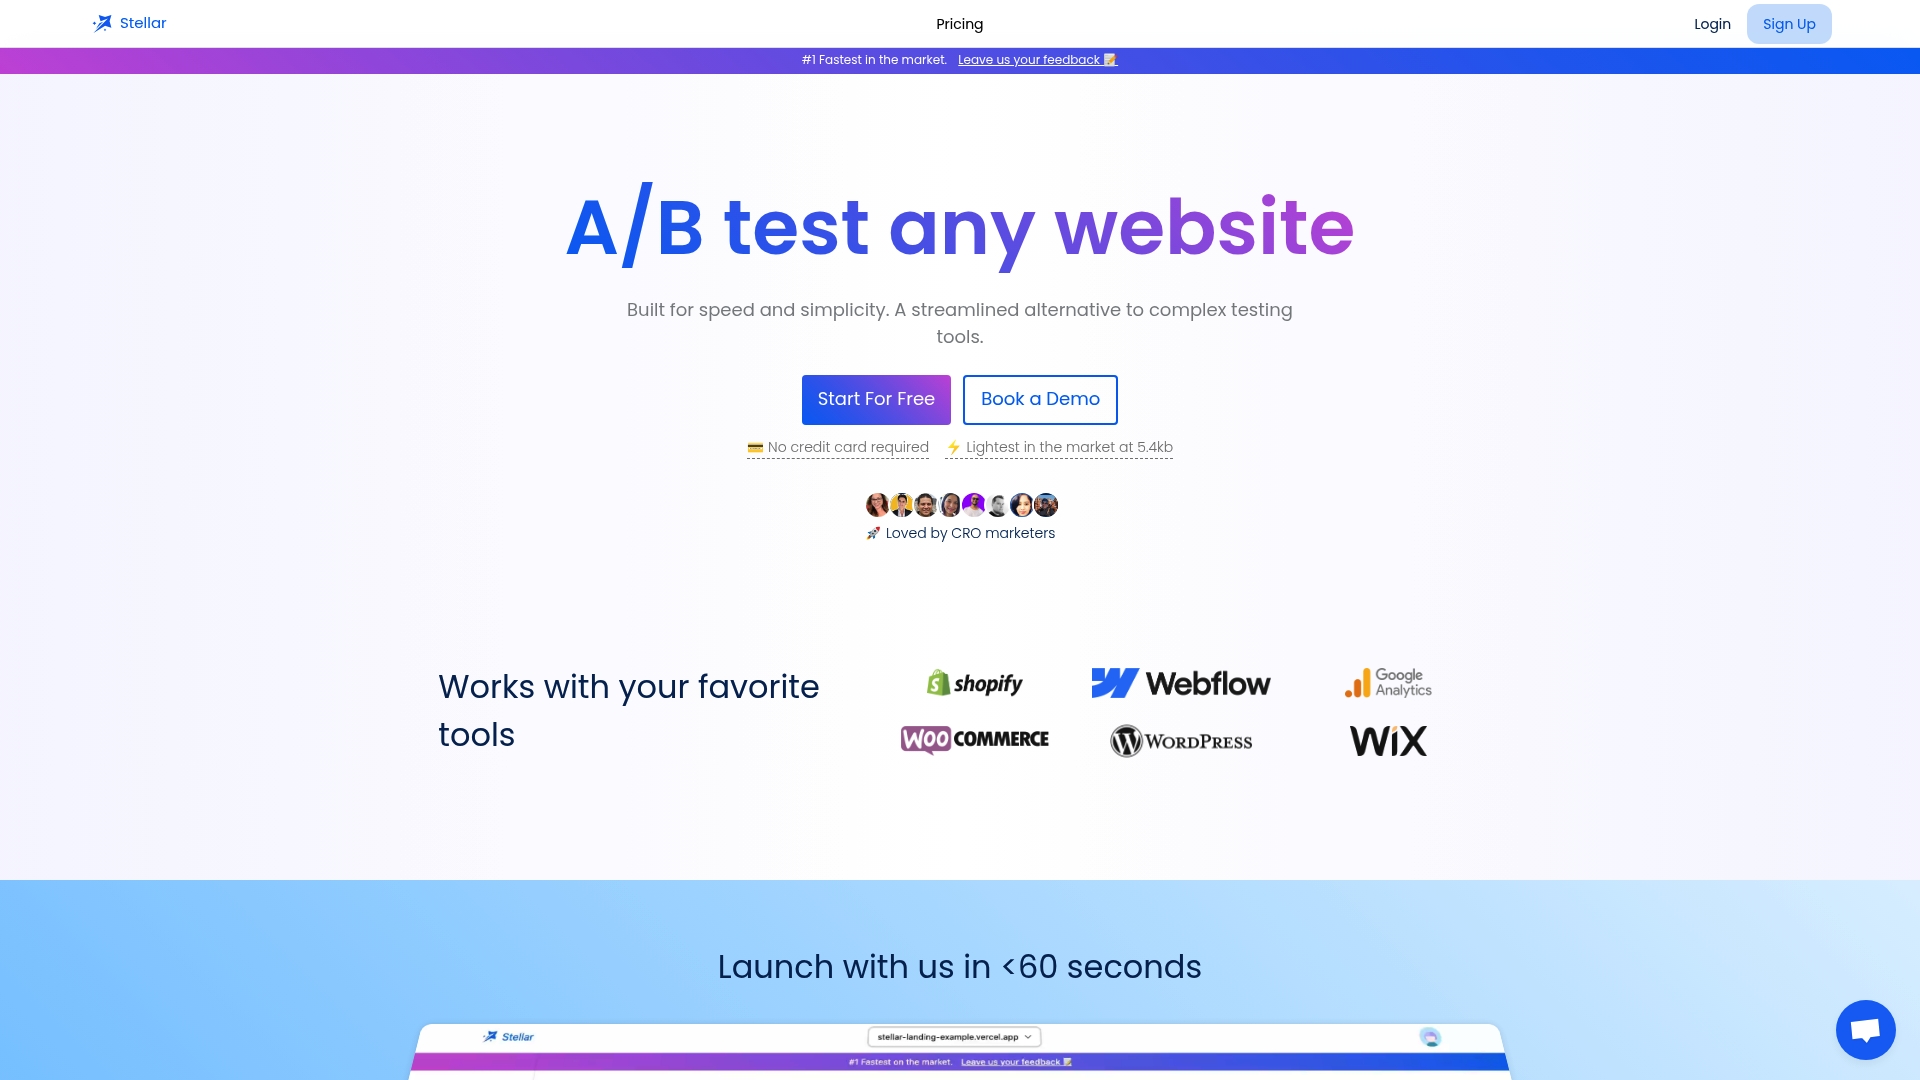
Start on the free Sandbox plan at gostellar.app and move to Plus at $29 per month when your testing program grows. If you want to see how a no-code workflow compares with enterprise-style setups, our piece on no-code experimentation for marketers lays it out.
FAQ
What is the difference between analytics and analysis?
Analysis is the broader activity of examining information to understand it and decide what to do. Analytics is the systematic, computational examination of data, the tools and methods that make that work possible. In practice you use analytics to produce the numbers and analysis to interpret them.
What are the four types of data analytics?
Descriptive analytics shows what happened, diagnostic explains why, predictive estimates what will happen, and prescriptive suggests what to do. Eurostat lists these four as the primary types. They work best used together.
What does an analytics analyst do?
They collect and clean data, build reports and models, and interpret the results so a team can make decisions. In a marketing or CRO team, that usually means tracking the funnel, finding where visitors drop off, and handing hypotheses to the people who run experiments. For deeper material, see our guide to advanced analytics for smarter marketing.
How do I turn analytics into decisions?
Start with one specific question, check your tracking, segment the data, write a hypothesis, and test it against a control. The decision comes from the test result, not from the report alone. Our guide to data-driven marketing decisions shows more examples.
Is A/B testing part of analytics?
It is the step that confirms analytics findings. Analytics shows where a problem is, and a controlled A/B test shows whether a specific change fixes it. If you are new to the method, start with the A/B testing definition.
Sources
- Analytics vs. Analysis: What's the Difference? | Watershed
- RDA BDA-IG: Big Data Analytics, Clarification of Terms
- Analysis vs. Analytics: Past vs. Future | EE Times
- De-Conflicting Terminology of Analytics | Association of Financial Professionals
- What Is Analytics? Types, Tools & Examples | Snowflake
- Glossary: Data analytics | Eurostat
- 4 Types of Data Analytics to Improve Decision-Making | HBS Online